
Business Intelligence Development
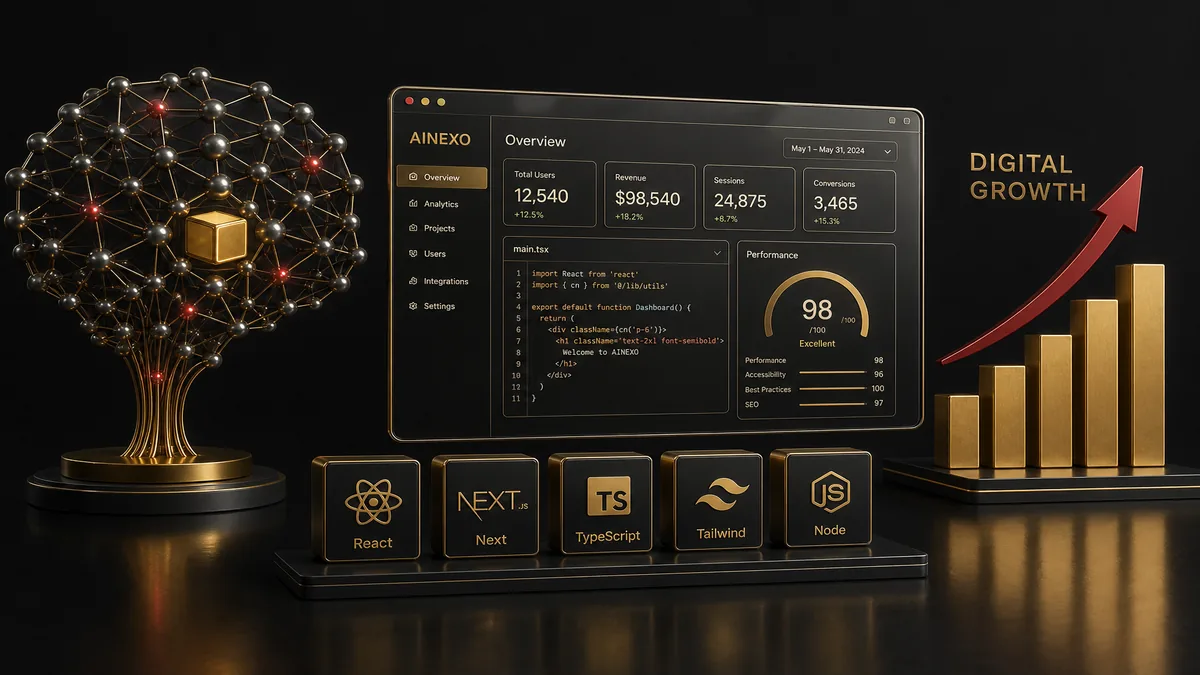
Introduction - business intelligence development
This builds the reporting layer executives and managers actually look at - consolidated dashboards pulling from your sales, operations, and finance systems into one place, instead of someone manually compiling numbers from five different spreadsheets every week.
The real work is usually in the data pipeline (getting clean, consistent data out of your existing systems), not the dashboard visuals themselves - we spend proportionate time there rather than polishing charts on top of messy underlying data.
Why the data pipeline matters more than the dashboard
A beautiful dashboard built on inconsistent or stale data actively misleads decision-makers - worse than no dashboard at all, since it looks authoritative. We prioritize getting the data pipeline reliable and current before investing heavily in visualization polish.
We scope BI projects around specific decisions you need to make better, not "give us visibility into everything" - a dashboard nobody references to make an actual decision isn't worth building.
What's included
- Data pipeline connecting your actual sales/ops/finance sources
- Data warehouse or consolidated reporting database setup
- Executive dashboard covering the specific metrics you act on
- Scheduled data refresh so numbers stay current automatically
- Drill-down capability from summary metrics to underlying detail
- Access controls so sensitive financial data reaches only the right people
Our process
1. Identify the decisions this should inform
We start with what decisions you're trying to make better, then work backward to what data and metrics actually matter.
2. Build the data pipeline first
Getting clean, consistent data flowing from your source systems happens before dashboard design - this is usually where most of the real work is.
3. Build & refine dashboards
Dashboards get built against the validated pipeline, refined based on what your team actually uses versus what goes ignored.
Pricing
Cost depends mainly on how many disparate data sources need to be consolidated, not the number of dashboard screens. Range: Rs 80,000 - 500,000 - indicative, final quote after discovery. Request a quote or WhatsApp +92 324 2991303.
Industries we serve
Growing companies making decisions off scattered spreadsheets, multi-branch retail needing consolidated performance visibility, and finance teams needing faster month-end reporting.